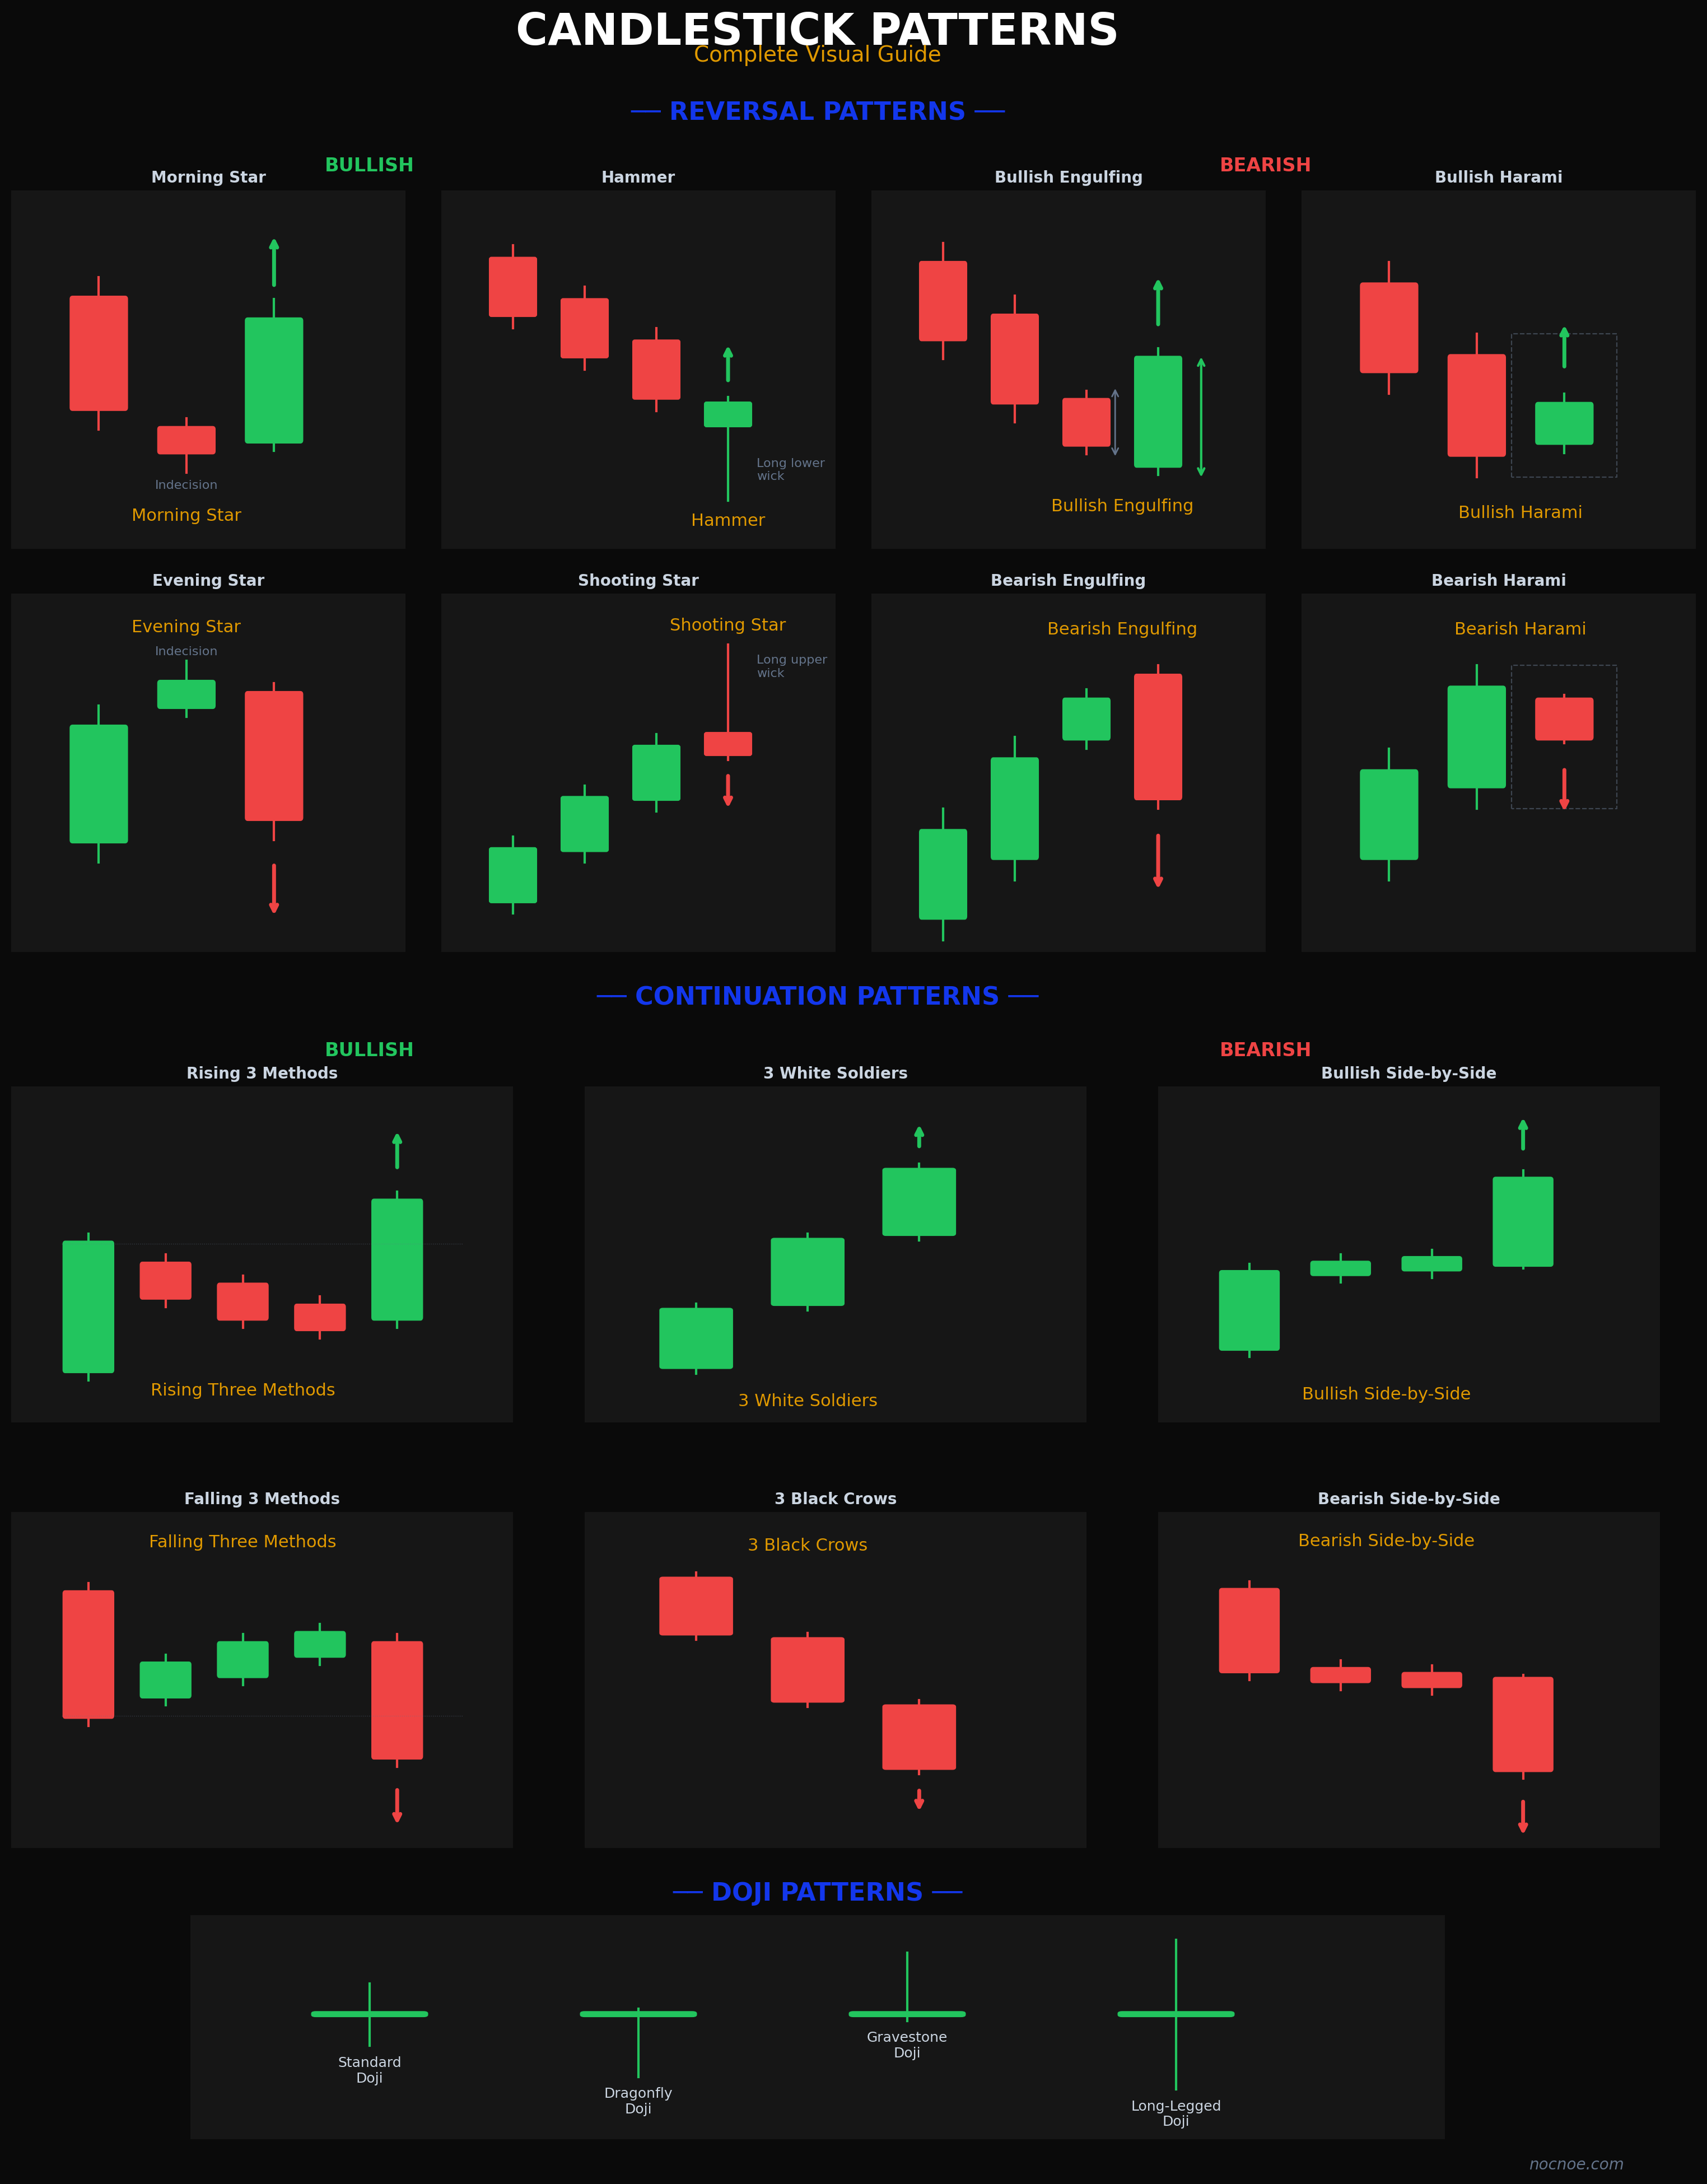
Candlestick Patterns: The Complete Visual Guide for Futures Traders
Category: Market Education
Learn 14 essential candlestick patterns with visual examples — reversal, continuation, and doji patterns explained for futures traders. Structure, psychology, and how to trade each one.
Every candlestick on a chart tells a story. It captures the battle between buyers and sellers within a specific time period — who showed up, who dominated, and who gave up. Understanding candlestick patterns gives you a direct read on market psychology without needing a single indicator.
This guide breaks down the 14 most important candlestick patterns every futures trader should know. We cover reversal patterns, continuation patterns, and doji formations — with visual examples for each.
What Are Candlestick Patterns?
A candlestick pattern is a specific arrangement of one or more candles that signals a potential price move. Each candle has four data points: open, high, low, and close. The relationship between these points — and between consecutive candles — reveals whether buyers or sellers are gaining or losing control.
Patterns fall into two categories:
- Reversal patterns — signal a potential trend change
- Continuation patterns — signal the current trend will likely resume
No pattern is 100% reliable on its own. Always confirm with support/resistance levels, volume, and broader market context. That said, these patterns are foundational — ignore them at your own risk.
Reversal Patterns
Reversal patterns appear at turning points. Bullish reversals show up after downtrends. Bearish reversals show up after uptrends. They signal that the prevailing side is losing control.
Hammer
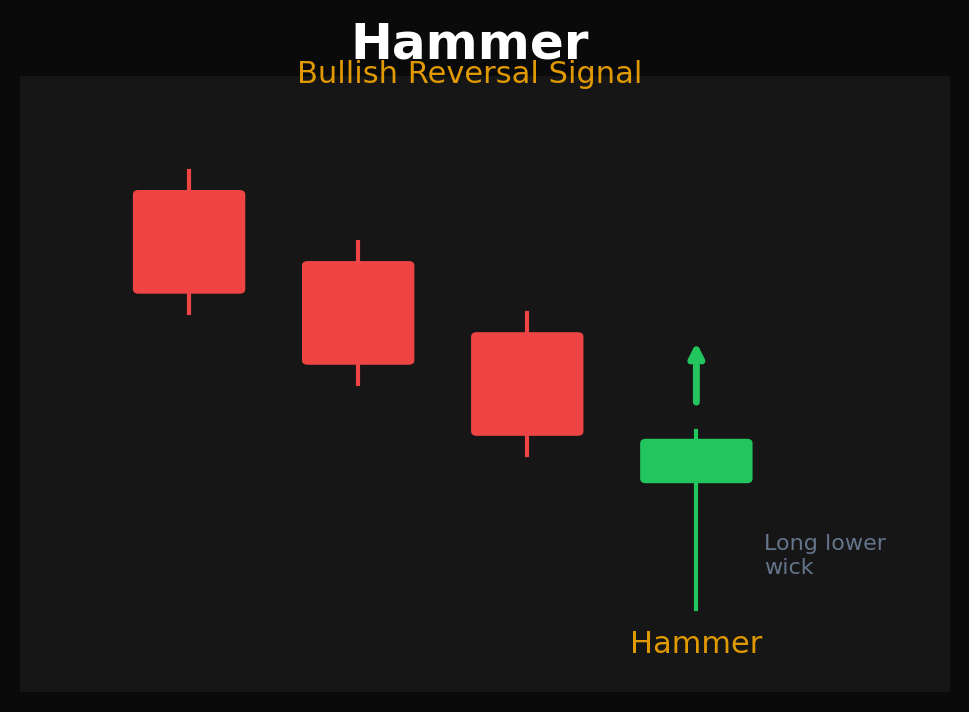
Type: Bullish Reversal | Candles: 1
Structure:
- Small body near the top of the candle
- Long lower wick (at least 2x the body length)
- Little to no upper wick
- Appears after a downtrend
Psychology: Sellers pushed price down hard during the session, but buyers stepped in and drove it back up near the open. The long lower wick shows rejection of lower prices — sellers tried and failed.
How to trade it: Wait for confirmation — a bullish candle closing above the hammer's high on the next session. Place stops below the hammer's low.
Shooting Star
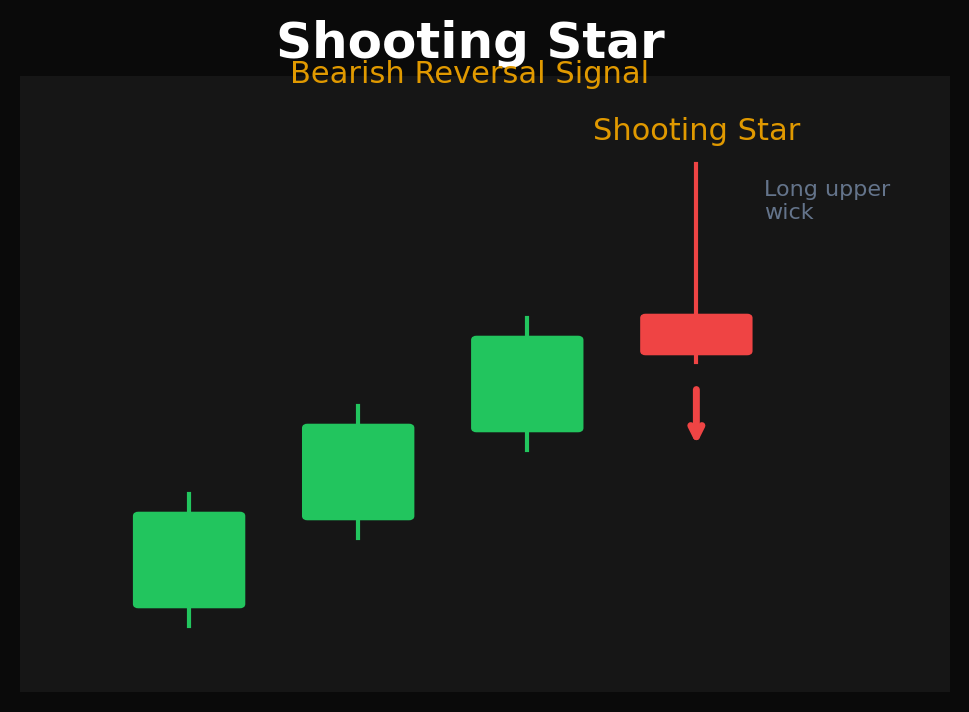
Type: Bearish Reversal | Candles: 1
Structure:
- Small body near the bottom of the candle
- Long upper wick (at least 2x the body length)
- Little to no lower wick
- Appears after an uptrend
Psychology: Buyers pushed price higher, but sellers rejected those levels and drove price back down. The long upper wick is the tell — bulls got trapped at the top.
How to trade it: Confirm with a bearish close below the shooting star's low. This pattern is especially powerful at resistance levels.
Bullish Engulfing
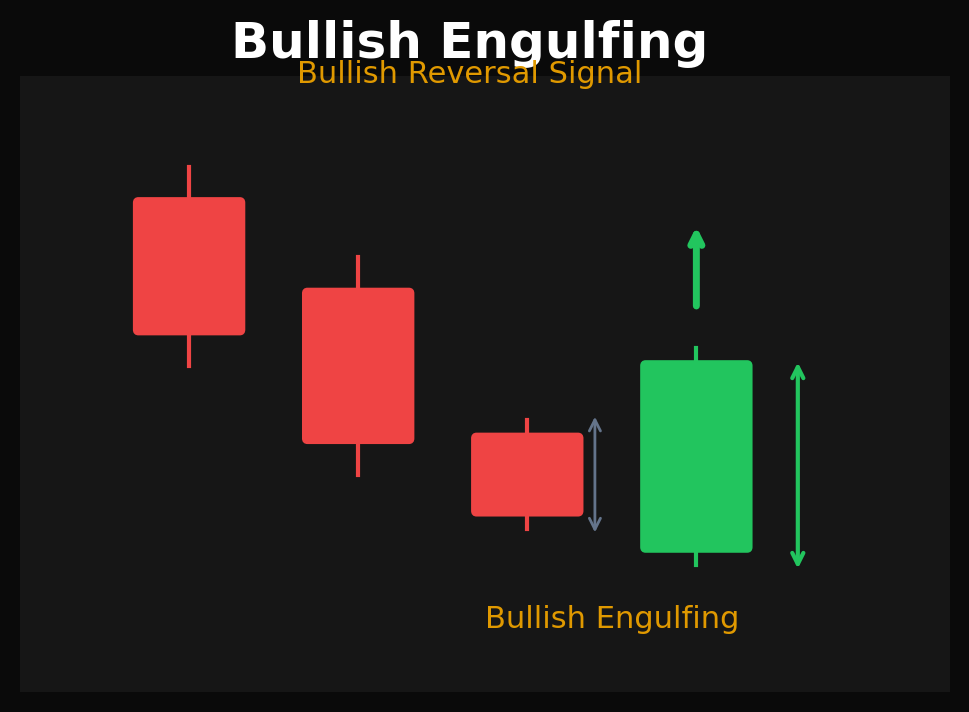
Type: Bullish Reversal | Candles: 2
Structure:
- First candle: small bearish (red) body
- Second candle: large bullish (green) body that completely engulfs the first candle's body
Psychology: Sellers had control with the first candle, but buyers came in with overwhelming force on the second — completely overpowering the prior session's selling. This is a momentum shift.
How to trade it: One of the strongest reversal signals. Enter on the close of the engulfing candle or on a break above its high. More reliable at support zones and with increased volume.
Bearish Engulfing
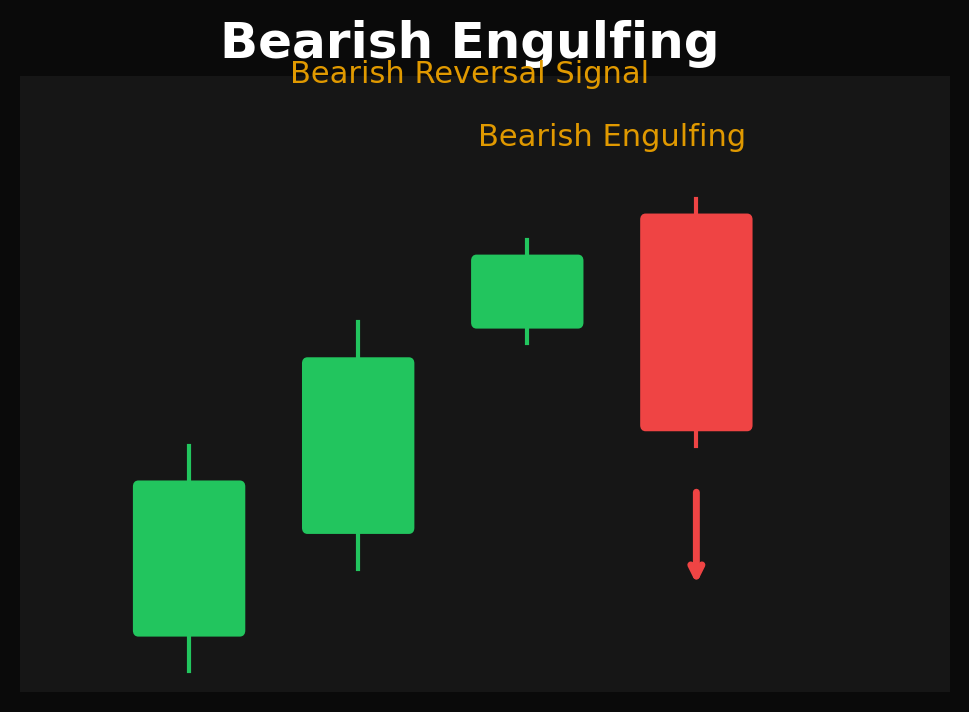
Type: Bearish Reversal | Candles: 2
Structure:
- First candle: small bullish (green) body
- Second candle: large bearish (red) body that completely engulfs the first candle
Psychology: Bulls made a weak push, then sellers overwhelmed them entirely. The bigger the engulfing candle relative to the first, the stronger the signal.
How to trade it: Confirm with a break below the engulfing candle's low. Especially effective at resistance levels and after extended uptrends.
Morning Star
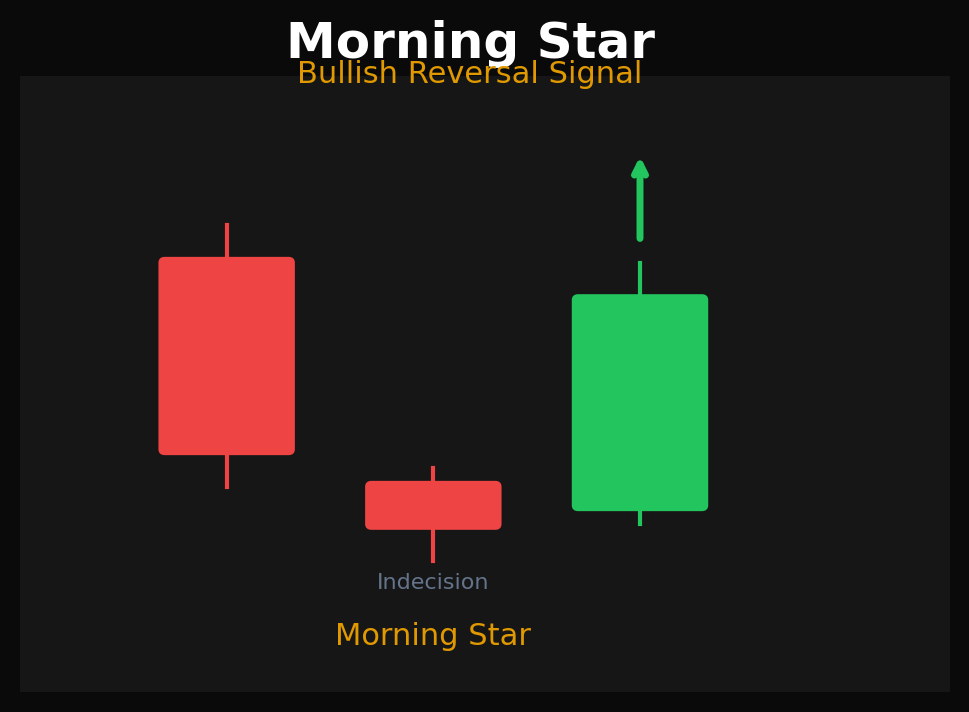
Type: Bullish Reversal | Candles: 3
Structure:
- First candle: large bearish candle (strong selling)
- Second candle: small body or doji (indecision — the "star")
- Third candle: large bullish candle closing well into the first candle's body
Psychology: Three acts of a drama. Act 1: sellers dominate. Act 2: momentum stalls, neither side wins. Act 3: buyers take over with conviction. The indecision candle is the pivot point where control changes hands.
How to trade it: Wait for the third candle to close. The deeper it closes into the first candle's range, the stronger the reversal signal. Volume should increase on the third candle.
Evening Star
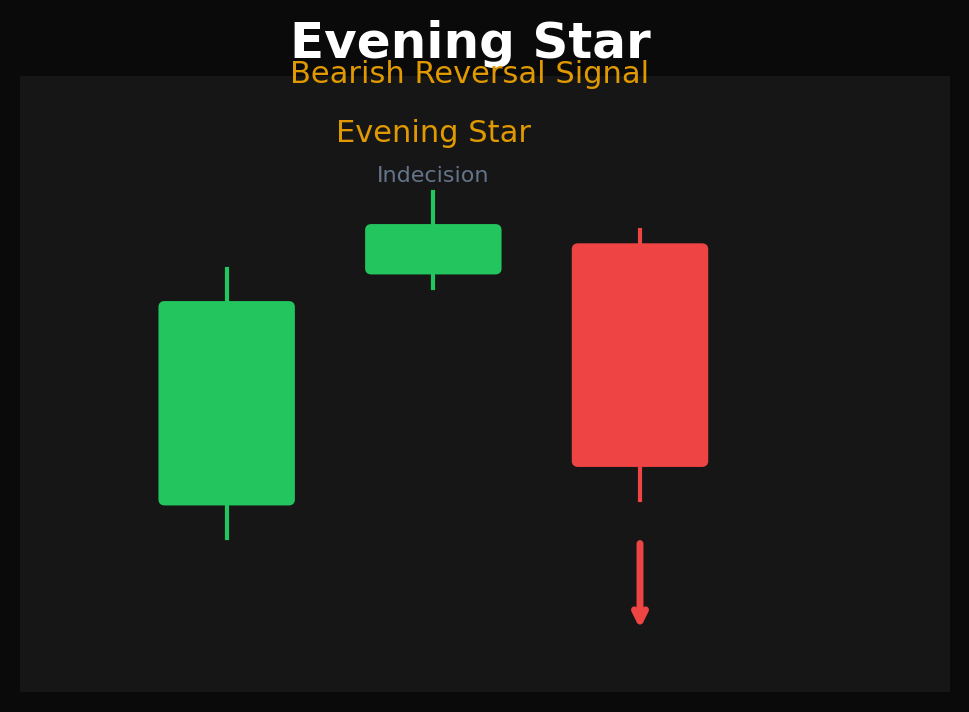
Type: Bearish Reversal | Candles: 3
Structure:
- First candle: large bullish candle
- Second candle: small body or doji (indecision)
- Third candle: large bearish candle closing deep into the first candle's body
Psychology: Mirror of the morning star. Buyers run out of steam, indecision sets in, then sellers take control. This is the top of the trend unraveling in three candles.
How to trade it: Confirm on the third candle's close. Most reliable at major resistance levels or after extended rallies.
Bullish Harami
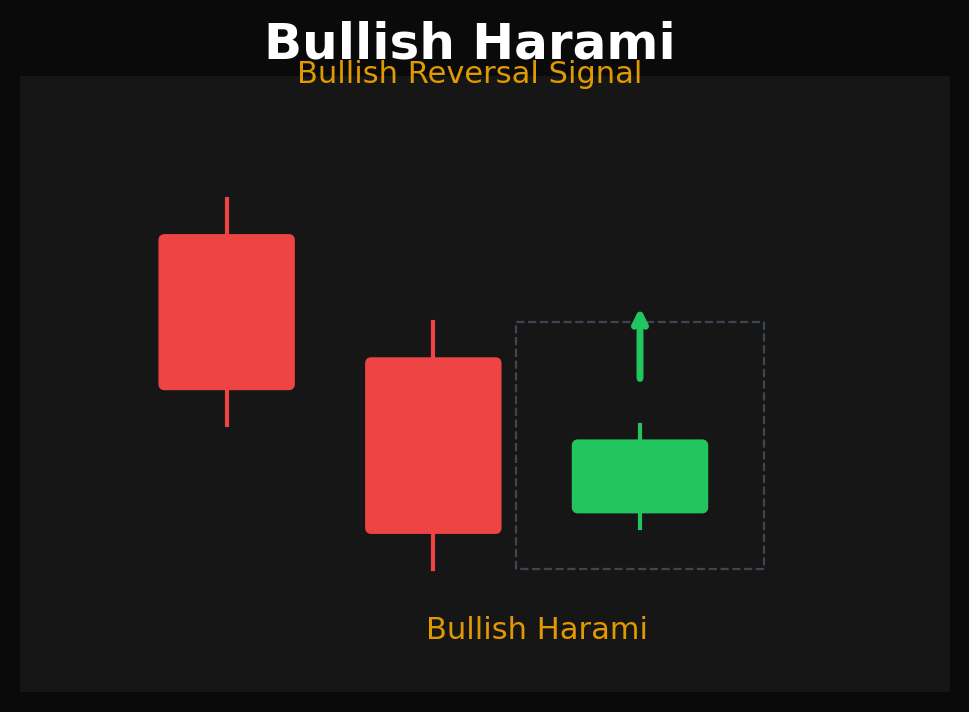
Type: Bullish Reversal | Candles: 2
Structure:
- First candle: large bearish body
- Second candle: small bullish body entirely contained within the first candle's body
Psychology: "Harami" means pregnant in Japanese — the small candle is contained inside the large one. Selling pressure is exhausting. The small bullish candle shows buyers are testing the waters, but haven't committed fully yet.
How to trade it: This is a weaker reversal signal than engulfing patterns. Wait for a confirming bullish candle on the third session before entering. Works best at established support levels.
Bearish Harami
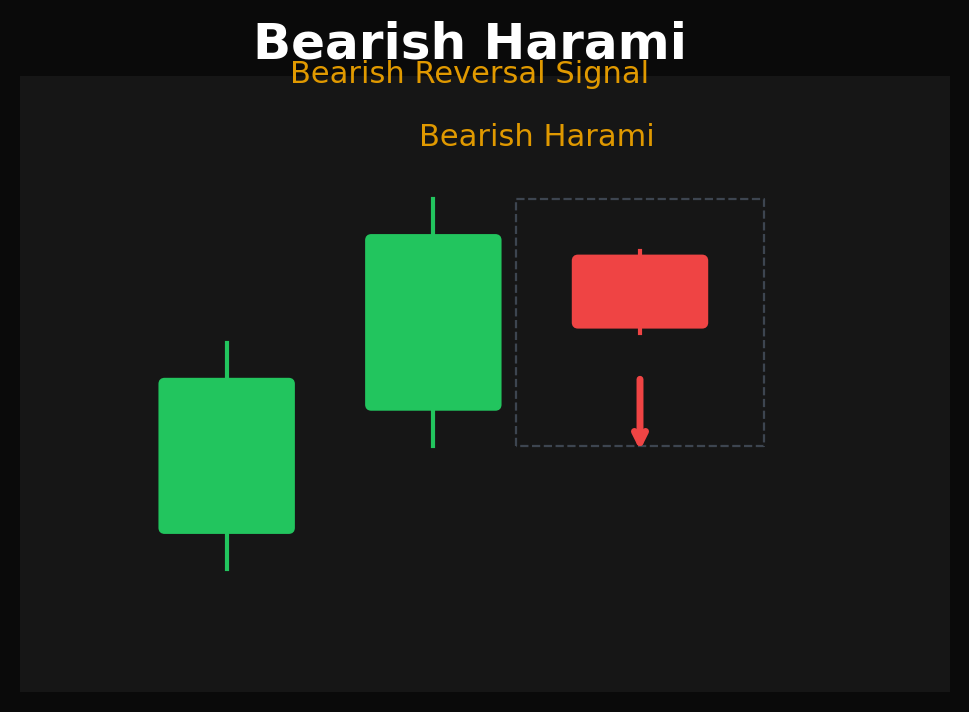
Type: Bearish Reversal | Candles: 2
Structure:
- First candle: large bullish body
- Second candle: small bearish body entirely inside the first candle's body
Psychology: Buying momentum is fading. The small bearish candle inside the large bullish one shows that bulls can't sustain their push. Sellers are starting to show up.
How to trade it: Like the bullish harami, this needs confirmation. Look for a bearish follow-through candle. Combine with resistance levels for higher probability setups.
Continuation Patterns
Continuation patterns appear mid-trend. They represent a pause — consolidation or a brief pullback — before the prevailing trend resumes. Think of them as the market catching its breath.
Three White Soldiers
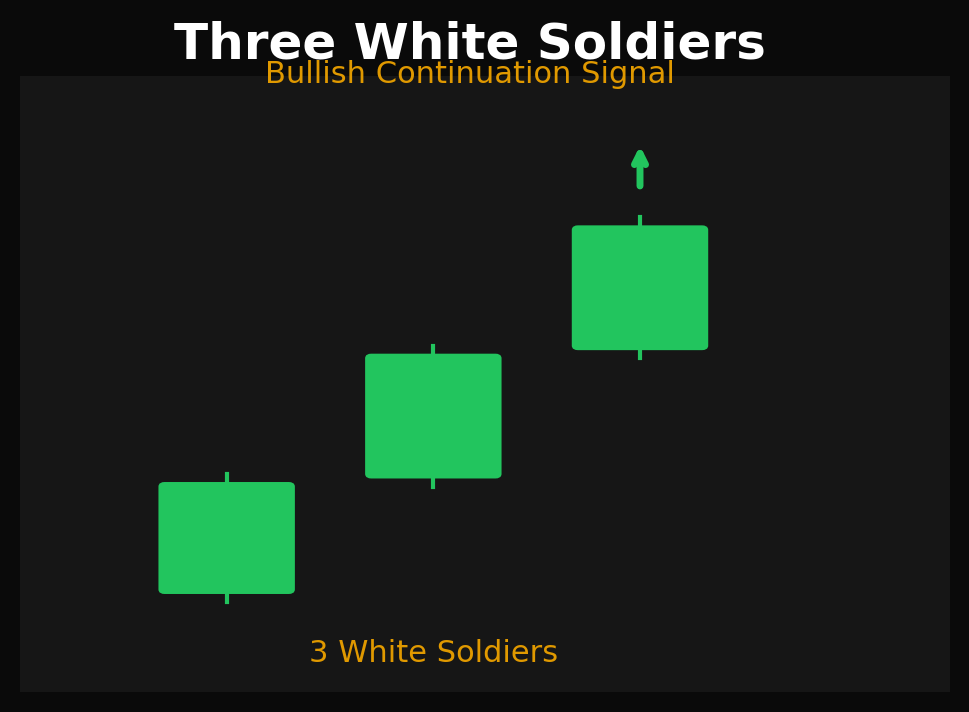
Type: Bullish Continuation | Candles: 3
Structure:
- Three consecutive bullish candles
- Each opens within the prior candle's body and closes higher
- Small or no lower wicks — buyers controlled the entire session
Psychology: Aggressive, sustained buying pressure across three sessions. No hesitation, no significant pullbacks. This is conviction buying — the trend has strong momentum behind it.
How to trade it: Enter on the close of the third candle or on a pullback. Watch for exhaustion if the candles get progressively smaller — that weakens the signal.
Three Black Crows
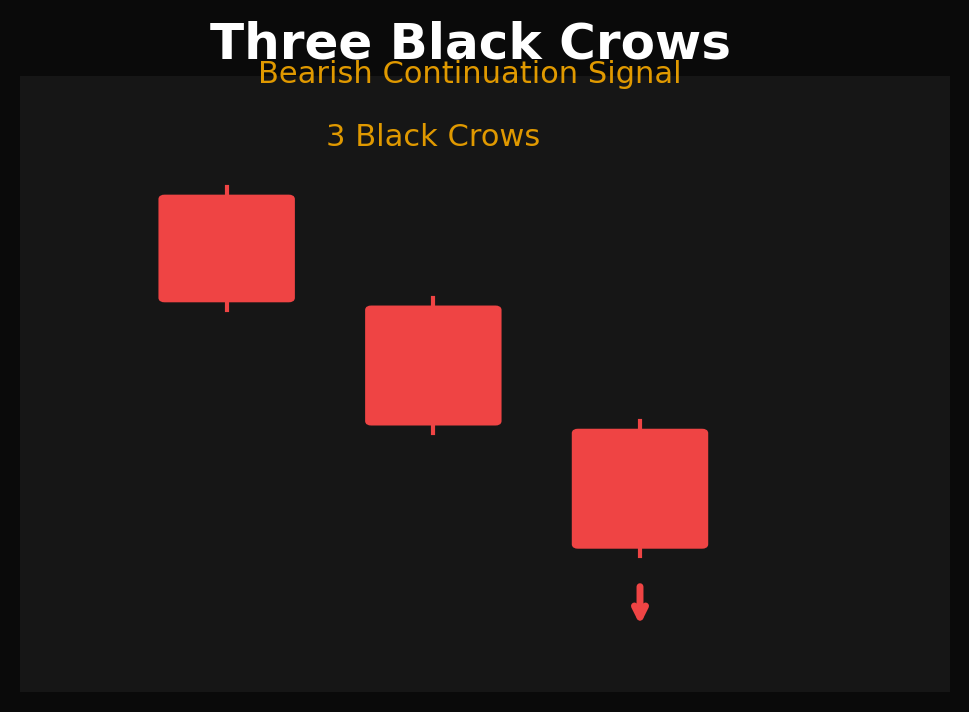
Type: Bearish Continuation | Candles: 3
Structure:
- Three consecutive bearish candles
- Each opens within the prior candle's body and closes lower
- Small upper wicks — sellers dominated each session
Psychology: Relentless selling across three sessions. No meaningful bounce attempts. This is capitulation or strong institutional selling.
How to trade it: Don't try to catch a falling knife when you see this pattern. If you're short, ride it. If you're flat, wait for the pattern to complete before looking for short entries on a retest.
Rising Three Methods
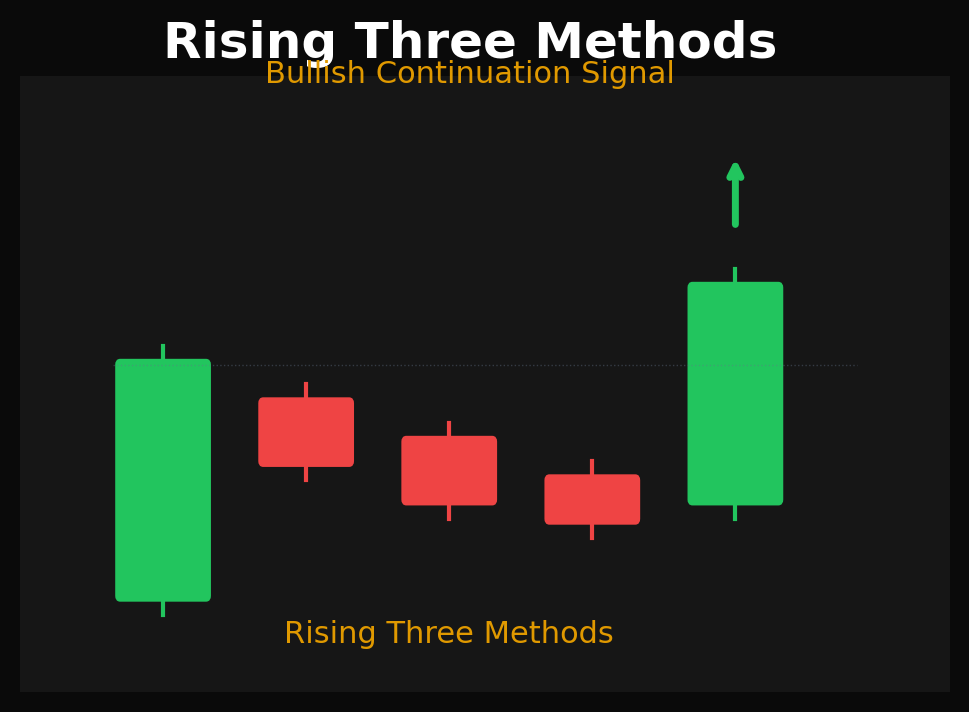
Type: Bullish Continuation | Candles: 5
Structure:
- Strong bullish candle
- Three small bearish candles that stay within the first candle's range (consolidation)
- Final strong bullish candle breaking above the range
Psychology: The initial push shows buyer strength. The three small bearish candles are a controlled pullback — sellers test the waters but can't push price below the first candle's low. Then buyers return with the fifth candle, confirming the trend is intact.
How to trade it: Enter when the fifth candle closes above the first candle's high. The consolidation phase (candles 2-4) should stay within the range of candle 1 — if they break below, the pattern is invalid.
Falling Three Methods
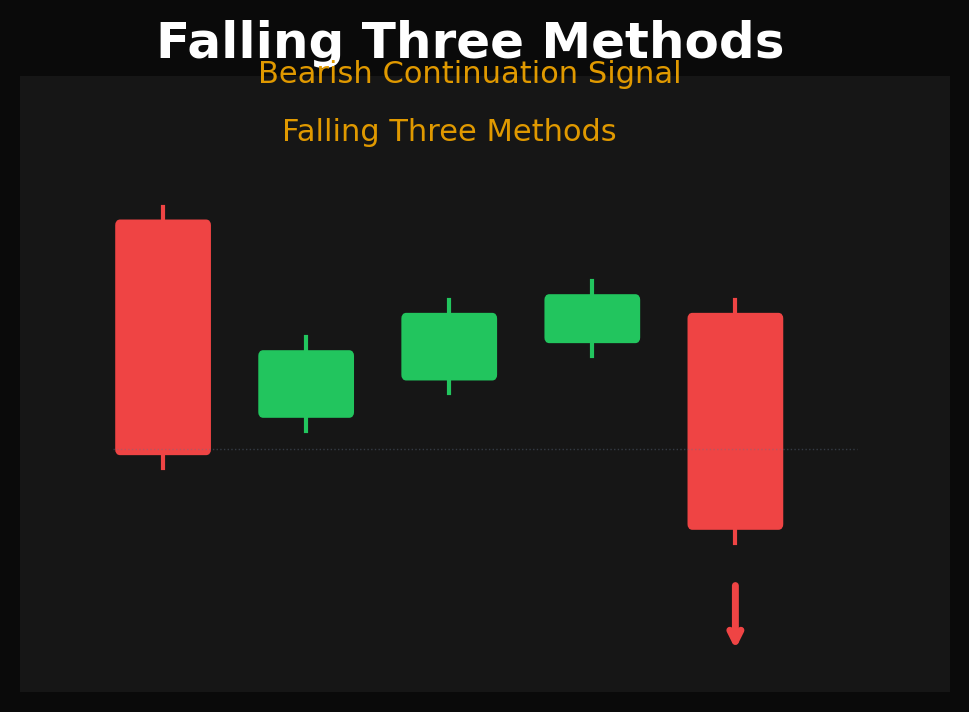
Type: Bearish Continuation | Candles: 5
Structure:
- Strong bearish candle
- Three small bullish candles within the first candle's range
- Final strong bearish candle breaking below the range
Psychology: Mirror of the rising three methods. A weak relief rally gets absorbed by sellers, and then the downtrend continues with conviction. The small bullish candles are a dead cat bounce — they don't have the strength to change the trend.
How to trade it: Enter short when the fifth candle breaks below. The consolidation candles must stay within the first candle's range. This pattern works well during strong down-trending markets.
Bullish & Bearish Side-by-Side
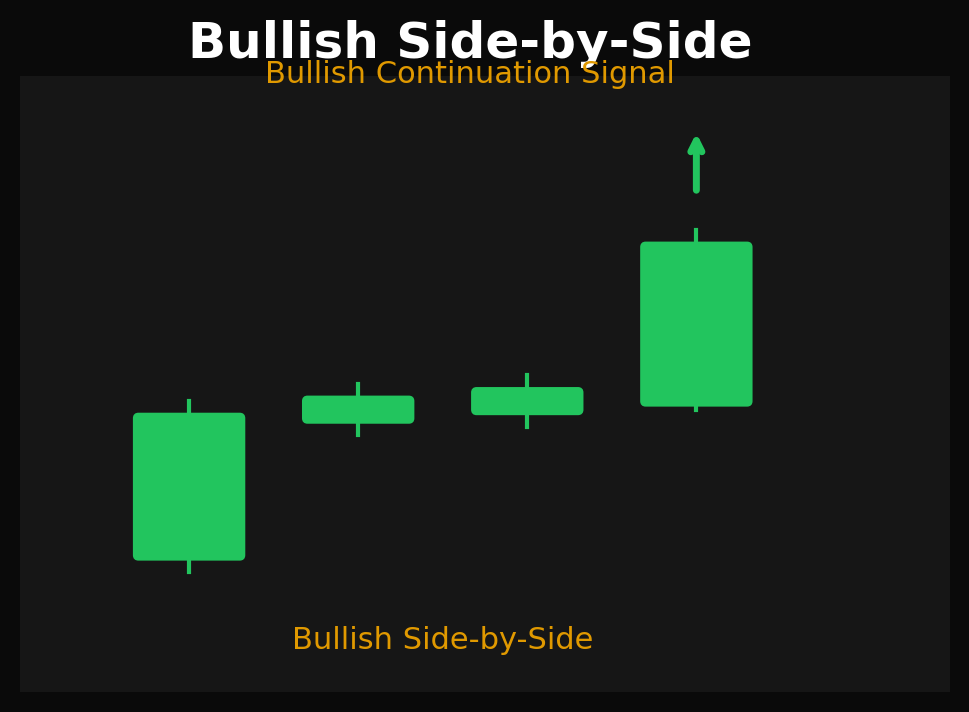
Type: Continuation | Candles: 3-4
Structure:
- Strong directional candle establishing the trend
- Small candles moving sideways (tight consolidation)
- Breakout candle continuing in the original direction
Psychology: The market pauses to digest the initial move. The prevailing side doesn't give ground — they just stop pushing momentarily. When volume returns, the move continues. Think of it as a flag pattern at the candle level.
Doji Patterns
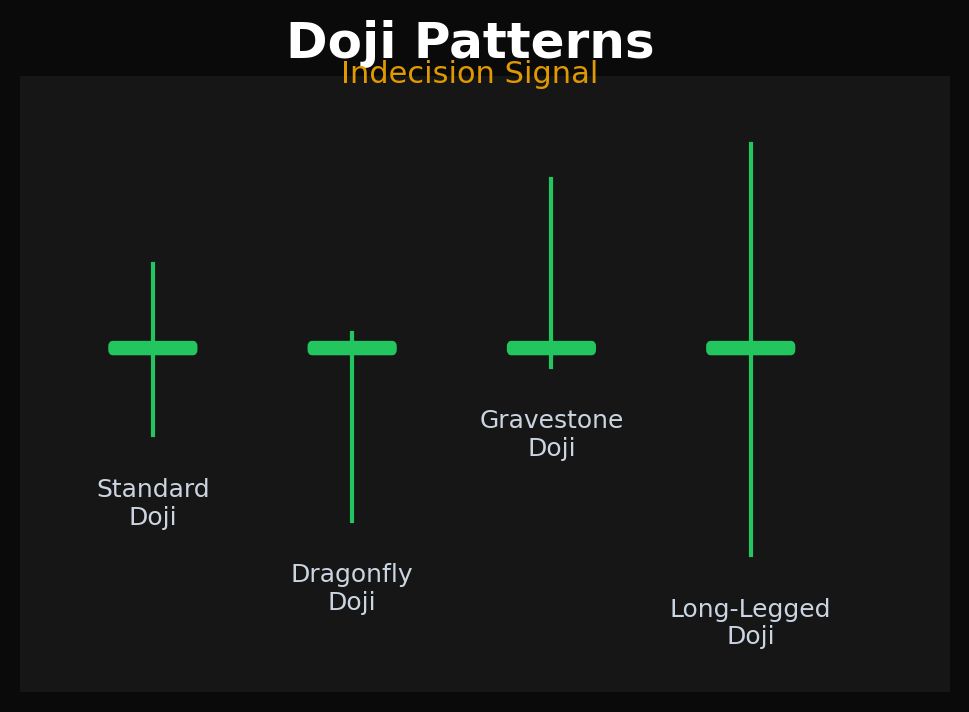
Doji candles are unique — the open and close are nearly identical, creating a cross or plus sign shape. They represent pure indecision. Neither buyers nor sellers won the session.
Standard Doji
Equal upper and lower wicks with the open/close in the middle. Complete standoff between buyers and sellers. After a strong trend, a standard doji can signal exhaustion.
Dragonfly Doji
Open and close at the top with a long lower wick. Sellers pushed price down hard, but buyers brought it all the way back. At the bottom of a downtrend, this is a bullish signal — similar to a hammer but with more emphasis on the reversal.
Gravestone Doji
Open and close at the bottom with a long upper wick. Buyers pushed higher but got completely rejected. At the top of an uptrend, this is a bearish signal — buyers tried and failed.
Long-Legged Doji
Extended wicks on both sides with the open/close in the middle. Extreme volatility with no resolution. The market moved dramatically in both directions but ended exactly where it started. This signals major uncertainty — a big move is likely coming, but the direction is unclear.
How to Use Candlestick Patterns in Futures Trading
Candlestick patterns are tools, not guarantees. Here's how to use them effectively:
1. Context Matters Most
A hammer at a major support level is far more significant than a hammer in the middle of nowhere. Always identify where in the broader structure the pattern appears — support, resistance, trendlines, or key moving averages.
2. Higher Timeframes Are More Reliable
A bearish engulfing on a daily chart carries more weight than one on a 5-minute chart. For futures trading, the daily and weekly timeframes produce the most reliable candlestick signals. Intraday patterns work best when they align with higher-timeframe structure.
3. Volume Confirms
The best candlestick signals come with volume confirmation. A bullish engulfing on 2x average volume is a much stronger signal than one on thin volume. If the pattern doesn't have volume behind it, treat it with skepticism.
4. Wait for Confirmation
Don't jump in the moment you spot a pattern. Wait for the next candle to confirm the signal. A morning star means nothing if the fourth candle closes bearish. Patience separates disciplined pattern traders from reactive ones.
5. Combine With Your Existing Strategy
Candlestick patterns work best as confluence — one piece of evidence among several. If your strategy identifies a support level, volume is increasing, and a hammer appears at that level, you have a high-probability setup.
Pattern Reliability Quick Reference
| Pattern | Type | Reliability | Best Timeframe |
|---|---|---|---|
| Bullish Engulfing | Reversal | High | Daily / Weekly |
| Bearish Engulfing | Reversal | High | Daily / Weekly |
| Morning Star | Reversal | High | Daily / Weekly |
| Evening Star | Reversal | High | Daily / Weekly |
| Three White Soldiers | Continuation | High | Daily |
| Three Black Crows | Continuation | High | Daily |
| Hammer | Reversal | Medium-High | Daily / 4H |
| Shooting Star | Reversal | Medium-High | Daily / 4H |
| Rising Three Methods | Continuation | Medium | Daily |
| Falling Three Methods | Continuation | Medium | Daily |
| Bullish Harami | Reversal | Medium | Daily / Weekly |
| Bearish Harami | Reversal | Medium | Daily / Weekly |
| Doji | Indecision | Context-dependent | All |
Bottom Line
Candlestick patterns are the language of price action. They've been used by traders for centuries — first in Japanese rice markets, now on every futures exchange in the world. The patterns in this guide cover the formations you'll encounter most frequently on NQ, ES, RTY, and other futures contracts.
Master them, and you'll read charts differently. You'll spot the moment sellers are losing conviction, or the session where buyers showed up with size. That edge compounds over time.
Start with the reversal patterns — they're the most actionable. Then layer in continuation patterns to stay on the right side of trends. And when you see a doji after a big move, pay attention. The market is telling you something.
Want to track how candlestick patterns play out in your own trading? NocNoe's trade journal lets you log, review, and get AI-powered feedback on every trade — including pattern recognition and entry quality analysis.